Wednesday, 14 January 2015
Monday, 4 March 2013
Copper : The move gets foxier
While I wrote my appreciation for today in my last post Copper : Intraday Moves and Trade Setup for 04 March 2013, today's moves so far make me have a rethink and the other possibilities that are created by my imaginations (which tend to go wild at times) are depicted in the chart below :
The EW counts work out like so:
| A | 427.6 | - | 433.45 | = | -5.85 | |||
| B | 433.45 | - | 425.5 | = | 7.95 | -135.897 | ||
| C | 425.5 | - | 440.8 | = | -15.3 | 261.5385 | (Potential) |
Saturday, 2 March 2013
Copper : Intraday Moves and Trade Setup for 04 March 2013
While I posted a detailed view on copper based on daily chart yesterday (Copper : A Recheck of Trade Setup), without an appreciation of intraday charts, the view would remain incomplete.
An hourly chart, marked with necessary comments, are posted below:
Friday, 1 March 2013
Copper : A Recheck of Trade Setup
Copper February 2013 futures is already over & done with and it is time to have a look at the charts of April 2013 futures to arrive at a possible trade setup. While I delve upon the possibilities that are visible on the limited period daily charts available to me, I would urge the readers to explore further into the longer term charts and evolve their strategies for their respective trades.
Without wasting much time, I would get back to the business of TA. I have drawn various charts and have placed them in the subsequent sections of this post, in the hope that they will help in making the readers understand the business of Technical Analysis, which would further help them in taking independent trading decisions.
Trend Lines
In the chart below, I have drawn few trend lines that I feel would significantly influence the futures moves and provide supports and resistances for the patterns to evolve. The vertical red lines indicate the time for a significant turn around point.
Channels
The chart below shows some of the channels, which, in my opinion, will control the future moves of copper April futures. At this juncture, the price action is within the light blue channel. If this channel is held, there would be a sharp downmove in the coming days. However, if this is breached, the price action may move up to test the yellow channel.
APF
The chart below shows some of the APFs that could play significant role in defining the expected moves.
Wolfe Wave
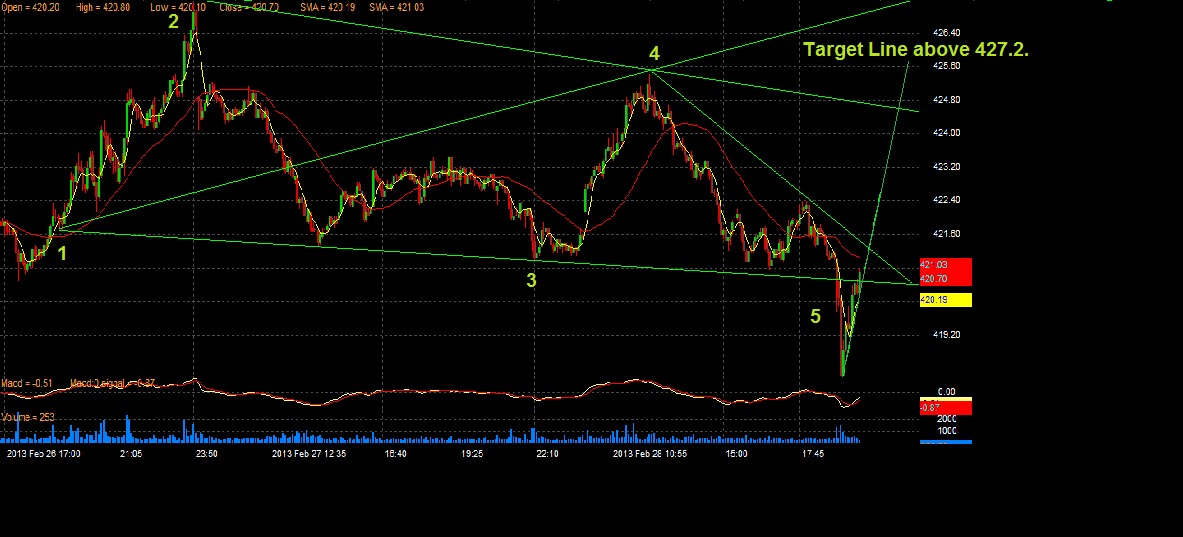
The Wolfe Wave, which I (and I presume the readers as well) followed for the February futures continues to prevail in the April futures also. The corresponding figures would change and hence the consequent targets would also need to be redefined. The Wolfe wave is shown in the chart below for easy reference...
Elliot Wave
In light of the TLs, channels, APFs and the WW that were shown above, let us see how the wave counts are shaping up. Shown below is my most preferred EW count for the April 2013 futures. Looks fairly simple but readers should not forget that copper could now be trading in C4 as per this count and it sure is going to confuse the hell out of traders before it finishes and leaves the way for C5. Those who are not well versed are advised to wait and trade downwards (near or above the Yellow LTL) with tight SLs above prior peaks. I am a bit confused on the exact counts but levels below 411 will not surprise me.
Alternate Counts
As practiced by Ellioticians, every preferred count should have an alternate count. This alternate count keeps the trader aware of the consequences in case the preferred count fails. So, here is the alternate count, which also looks valid so far. Shorts therefore should be initiated very carefully and should always be associated with a carefully chosen SL. Coz if the preferred count fails, copper may rise beyond 465 in absolutely no time.
The Trade Setup
For Bulls - Go long as close to 425.5 with SL below 424.2 for a target above 432, which may extend further if copper ticks at 434.3.
For Bears - Go short above 432 with a SL of 434.3 for a target of 424.25, 411, 403, 390.
Without wasting much time, I would get back to the business of TA. I have drawn various charts and have placed them in the subsequent sections of this post, in the hope that they will help in making the readers understand the business of Technical Analysis, which would further help them in taking independent trading decisions.
Trend Lines
In the chart below, I have drawn few trend lines that I feel would significantly influence the futures moves and provide supports and resistances for the patterns to evolve. The vertical red lines indicate the time for a significant turn around point.
Channels
The chart below shows some of the channels, which, in my opinion, will control the future moves of copper April futures. At this juncture, the price action is within the light blue channel. If this channel is held, there would be a sharp downmove in the coming days. However, if this is breached, the price action may move up to test the yellow channel.
APF
The chart below shows some of the APFs that could play significant role in defining the expected moves.
Wolfe Wave
The Wolfe Wave, which I (and I presume the readers as well) followed for the February futures continues to prevail in the April futures also. The corresponding figures would change and hence the consequent targets would also need to be redefined. The Wolfe wave is shown in the chart below for easy reference...
Elliot Wave
In light of the TLs, channels, APFs and the WW that were shown above, let us see how the wave counts are shaping up. Shown below is my most preferred EW count for the April 2013 futures. Looks fairly simple but readers should not forget that copper could now be trading in C4 as per this count and it sure is going to confuse the hell out of traders before it finishes and leaves the way for C5. Those who are not well versed are advised to wait and trade downwards (near or above the Yellow LTL) with tight SLs above prior peaks. I am a bit confused on the exact counts but levels below 411 will not surprise me.
Alternate Counts
As practiced by Ellioticians, every preferred count should have an alternate count. This alternate count keeps the trader aware of the consequences in case the preferred count fails. So, here is the alternate count, which also looks valid so far. Shorts therefore should be initiated very carefully and should always be associated with a carefully chosen SL. Coz if the preferred count fails, copper may rise beyond 465 in absolutely no time.
The Trade Setup
For Bulls - Go long as close to 425.5 with SL below 424.2 for a target above 432, which may extend further if copper ticks at 434.3.
For Bears - Go short above 432 with a SL of 434.3 for a target of 424.25, 411, 403, 390.
Thursday, 28 February 2013
Friday, 22 February 2013
Copper : The Fall Taking a Brief Pause
Copper has seen a rapid fall from 449.5 and has made a low of 425.15 so far. The indicators suggest that a brief recovery, which may go a shade higher than 432 (but must not go above 434.5) is in progress. Once this rise is done, another fall to below 399 (but not below 393) may be expected. Here is how the moves are perceived on the chart:

The basis of the expectation for the rise is the perception that 3rd wave of the fall is extended with respect to 5th. This presumption will get invalidated when copper ticks at 422.55. If it ticks at 422.55, 3rd will no longer be extended and 5th will have to extend for which, it has to go below 413.95 atleast.

The basis of the expectation for the rise is the perception that 3rd wave of the fall is extended with respect to 5th. This presumption will get invalidated when copper ticks at 422.55. If it ticks at 422.55, 3rd will no longer be extended and 5th will have to extend for which, it has to go below 413.95 atleast.
Tuesday, 19 February 2013
Copper : A beautiful Wolfe Wave, which met its target...
Copper did complete the Wolfe wave target now in a text book manner, as was expected in my post Copper: Moving Down as Expected and Copper : Trade Setup on 15 February 2013. Now, I expect it to show a rise in 3 wave corrective and atleast backtest the red LTL coming from the lowest point of the chart. The expectations are shown on the chart below :
Subscribe to:
Posts (Atom)