Thursday 28 February 2013

Copper : An Intraday Wolfe Targets 427.2+

Copper February Futures shows a Wolfe wave in Intrady Charts, which targets 427.2 or higher.  The trade can be initiated  above 420.55 with a SL of 420.4 or a SL of 418.15.


Friday 22 February 2013

Copper : The Fall Taking a Brief Pause

Copper has seen a rapid fall from 449.5 and has made a low of 425.15 so far.  The indicators suggest that a brief recovery, which may go a shade higher than 432 (but must not go above 434.5) is in progress.  Once this rise is done, another fall to below 399 (but not below 393) may be expected.  Here is how the moves are perceived on the chart:


The basis of the expectation for the rise is the perception that 3rd wave of the fall is extended with respect to 5th.  This presumption will get invalidated when copper ticks at 422.55.   If it ticks at 422.55, 3rd will no longer be extended and 5th will have to extend for which, it has to go below 413.95 atleast.

Tuesday 19 February 2013

Copper : A beautiful Wolfe Wave, which met its target...

Copper did complete the Wolfe wave target now in a text book manner, as was expected in my post Copper: Moving Down as Expected  and Copper : Trade Setup on 15 February 2013.  Now, I expect it to show a rise in 3 wave corrective and atleast backtest the red LTL coming from the lowest point of the chart.  The expectations are shown on the chart below :


Monday 18 February 2013

Copper: Moving Down as Expected


Now that the downward move, as expected in the yesterday's post Copper : Trade Setup on 15 February 2013,  has started, this is the path I expect copper to follow for February 2013 futures:


Friday 15 February 2013

Copper : Trade Setup on 15 February 2013.


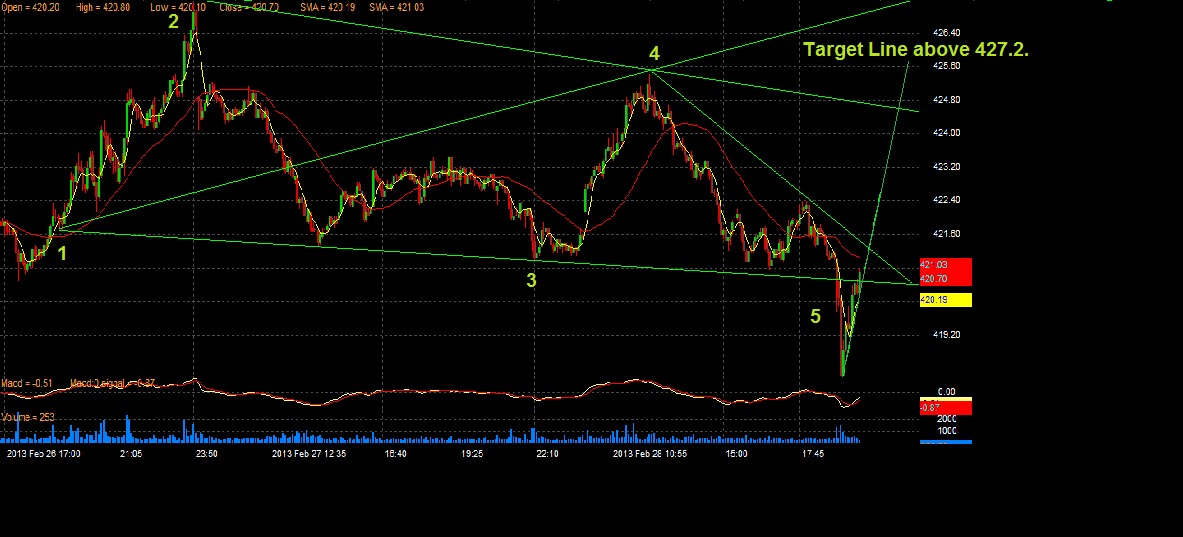
Today the broader picture in copper February future emerges like this:


 The daily chart above shows a Wolfe wave, which targets a much lower level.  However, for trading purposes, the green channel may be concentrated upon for the time being, which indicates 430 at its LTL.

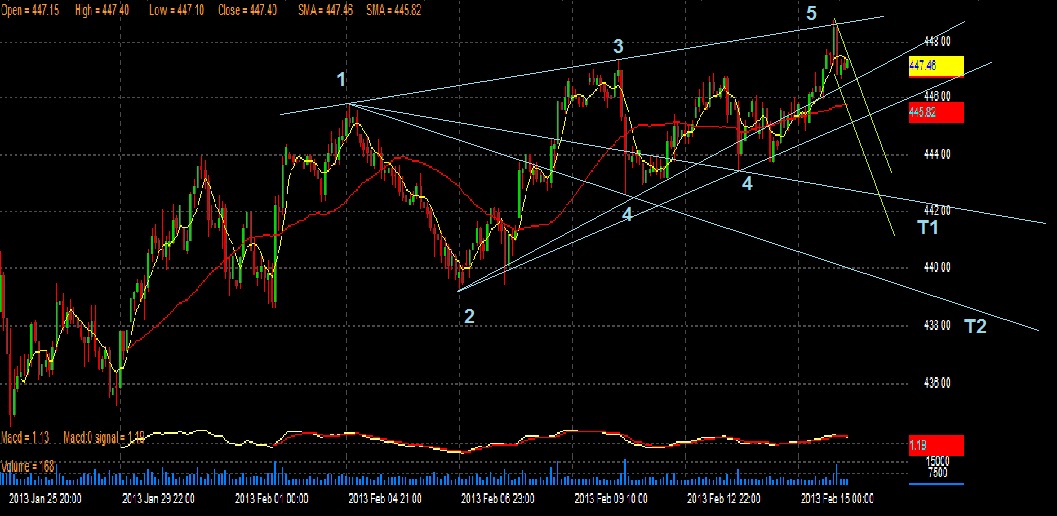
The hourly chart shown below, also has a Wolfe wave, which is tradeable in the shorter time-frame.  With T1 at 442 and T2 at 438, positions can be taken now with a SL of 447.65.  SL may be kept above the green UTL till it maintains within the green channel.


Friday 8 February 2013

Copper February futures

Copper February chart, which is posted below, shows APF in RED, WW in GREEN and EW fractals in white, yellow and light blue.  As I perceive, C3 may have started and should definitely go below 434.3....Rest later.


Thursday 7 February 2013

Copper : February Futures

Based on the chart below, I expect copper February futures to dip below 439.65, then rise beyond 442.7 (may go beyond 444) and then fall to 438-435.


Wednesday 6 February 2013

Copper : A Myopic View

While I would post the long term charts over the weekend, my myopic perception is depicted below:


Within the next 30 days or so, copper should sink towards 405 or lower.    A conservative target is depicted with yellow circle, while an aggressive target is depicted as a two color star  near 405 levels.    SL could be kept at 446 for these.